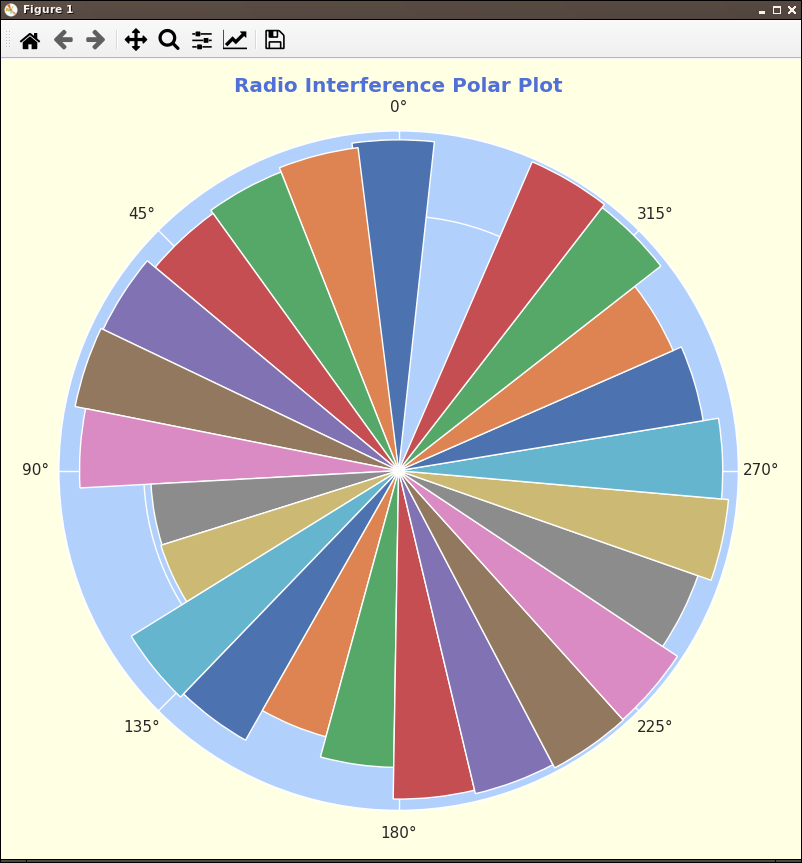
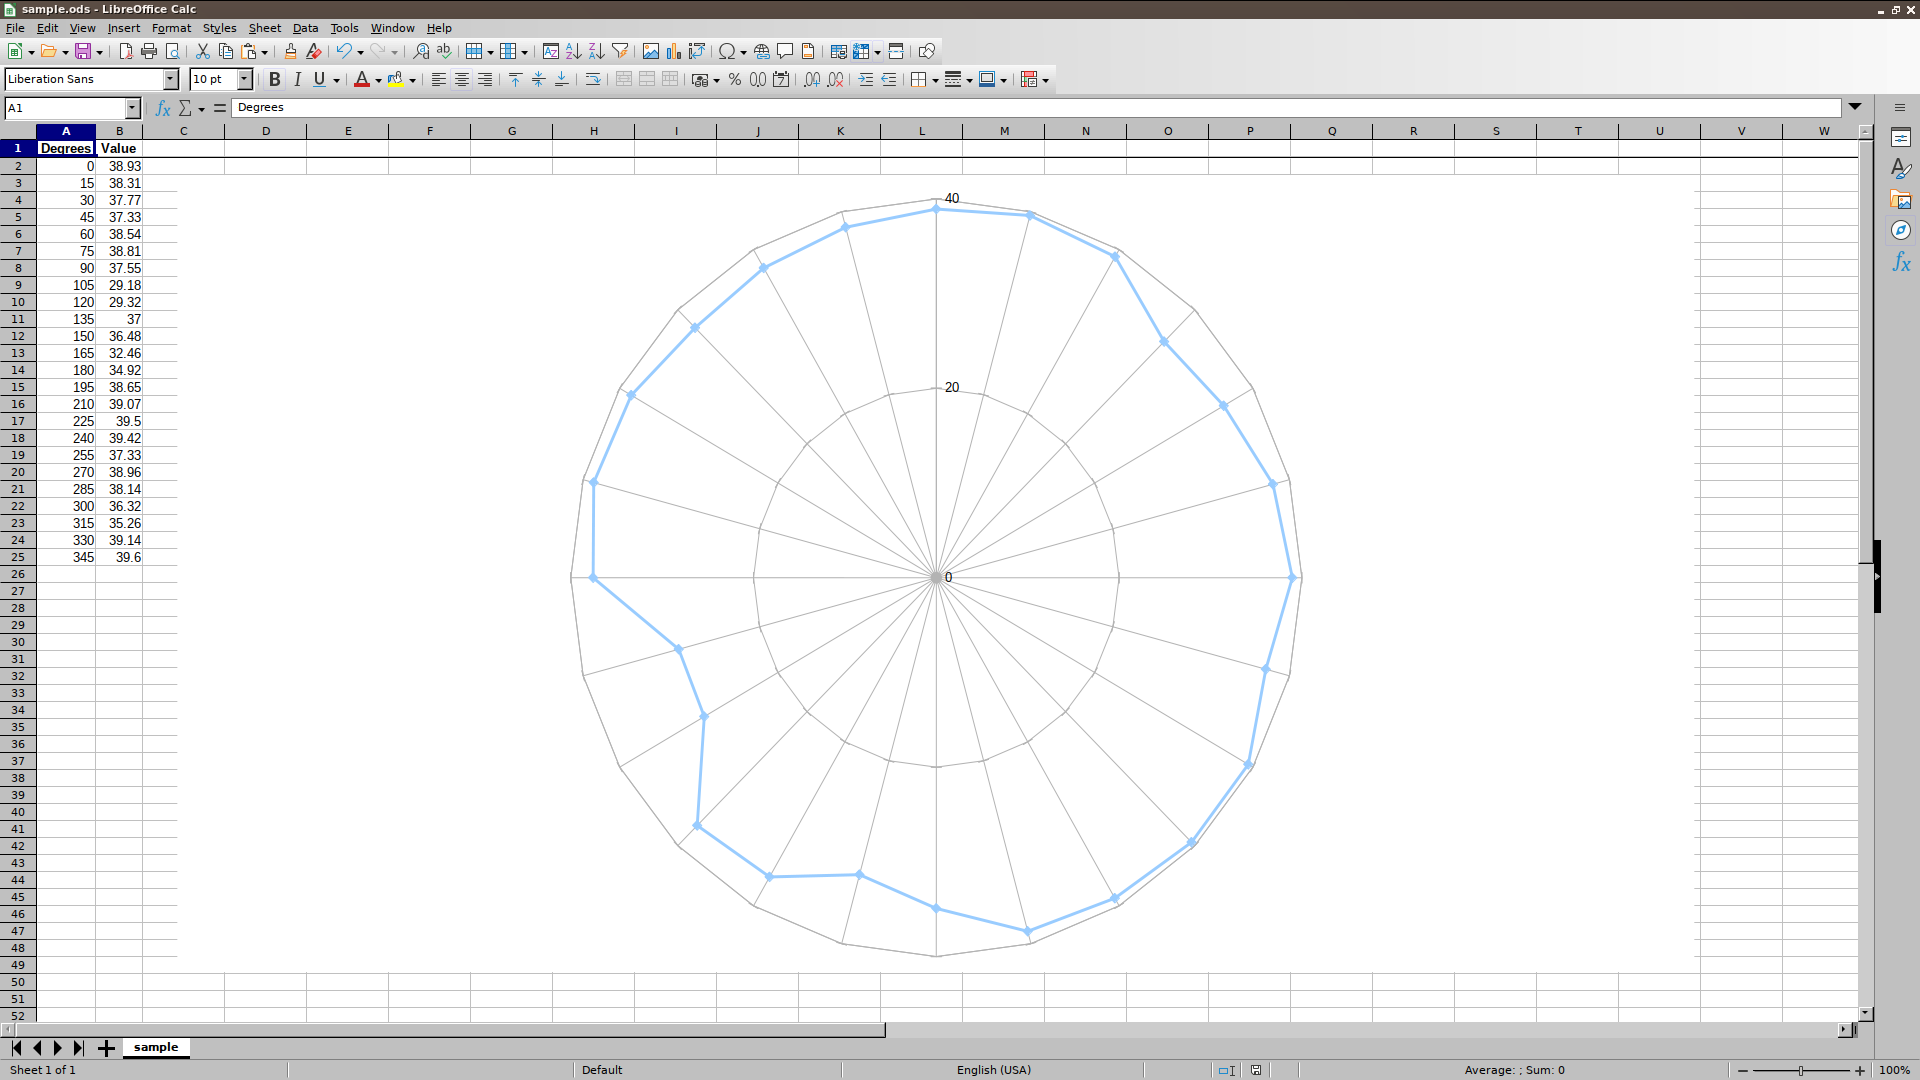
Don't look. Junk. Trying to figure out how to plot radio interference.
https://spacecruft.org/spacecruft/plot-freely
| data | ||
| img | ||
| .gitignore | ||
| get-samples | ||
| LICENSE-CC | ||
| LICENSE-GPL | ||
| polar-plot | ||
| README.md | ||
| requirements-dev.txt | ||
| requirements.txt | ||
Plot Freely
PRE-ALPHA
One day, perhaps, this code will be able to generate nice plots to visualize radio interference.
Installation
Install thusly, on Debian Bookworm (Testing).
sudo apt install python3-virtualenv python3-pip

git clone https://spacecruft.org/spacecruft/plot-freely
Setup
Setup thusly.
cd plot-freely/
virtualenv -p python3 env
source env/bin/activate
pip install --upgrade pip
pip install -r requirements.txt
deactivate
Usage
Use thusly.
cd plot-freely/
source env/bin/activate
./polar-plot
Development
Setup like above, and also:
cd plot-freely/
source env/bin/activate
pip install -r requirements-dev.txt
Then before committing new code, make sure it is enprettified:
black polar-plot
See Also
CygnusRFI
- https://spacecruft.org/spacecruft/CygnusRFI
- https://github.com/0xCoto/CygnusRFI
- https://community.libre.space/t/cygnusrfi-an-open-source-rfi-analysis-tool-for-ground-stations-radio-telescopes/5553
rtl_power
- http://kmkeen.com/rtl-power/
- https://github.com/keenerd/rtl-sdr-misc
- https://github.com/dhogborg/rtl-gopow
rx_tools
Upstream
Sections of code and clues from Cees Bassa.
Primary author and errors in code from Jeff Moe.
Copyright
Upstream sources under their respective copyrights.
License: CC By SA 4.0 International and/or GPLv3+ at your discretion.
Copyright © 2023, Jeff Moe.